The Perks of Using Data Visualization Tools for Brand Credibility

Featured Image: Freepik.com/vectorjuice
What will make you stop and browse through a website or long blog post? Most likely, appealing visuals, GIFs, or animations that tell you what the article is about when you are skimming through it. If there is a lot of data and information presented in the content, chances are that you will find it easier to process it with visualization. According to a study by MIT, 90 percent of the information that is transmitted to the human brain is visual.
For businesses and brands, data visualization can work very well for getting the message across to the audience. It can be used to present valuable insights and raw data in a simplified form. This can be very useful when you are trying to convince potential customers to make a purchasing decision and establish brand credibility too.
Let’s take a look at how and why you should use tools for data visualization to take your business to the next level.
What Is the Role of Data Visualization in Branding?
Now, you might be wondering how data visualization is related to branding. Well, the answer is quite simple. It is a way to break down complex numbers and metrics into visuals so that they are easy to understand. Most marketers also prefer visualized data to track the growth of email or social media campaigns for instance.
Similarly, the audience is likely to pay more attention to images, videos, or animations than just numbers or plain text.

Image Source: dribbble.com/
This is where data visualization can play a vital role in branding. With interactive visuals, it’s easier to engage potential customers on websites, blogs, or social media platforms and convince them to look for more information too.
By using your brand colors, font styles, and logo design to brand data visualization assets, you can establish credibility as well. This is a good way that businesses can earn the trust of consumers.
There are different types of data visualizations that you can consider in branding and marketing to help your consumers make a well-informed decision.
- Graphs
- Charts
- Infographics
- Animations
- Heatmaps
- Diagrams
You can grab the attention of the viewer instantly with such assets and drive a potential customer to the end of their journey successfully. For an eCommerce brand, data visualization can be quite useful in generating higher online sales and conversions.
Business owners could win with attractive data metrics in UX design, short animations, or slider images on their websites. Sometimes, simple infographics can also make the right impression on the visitor.
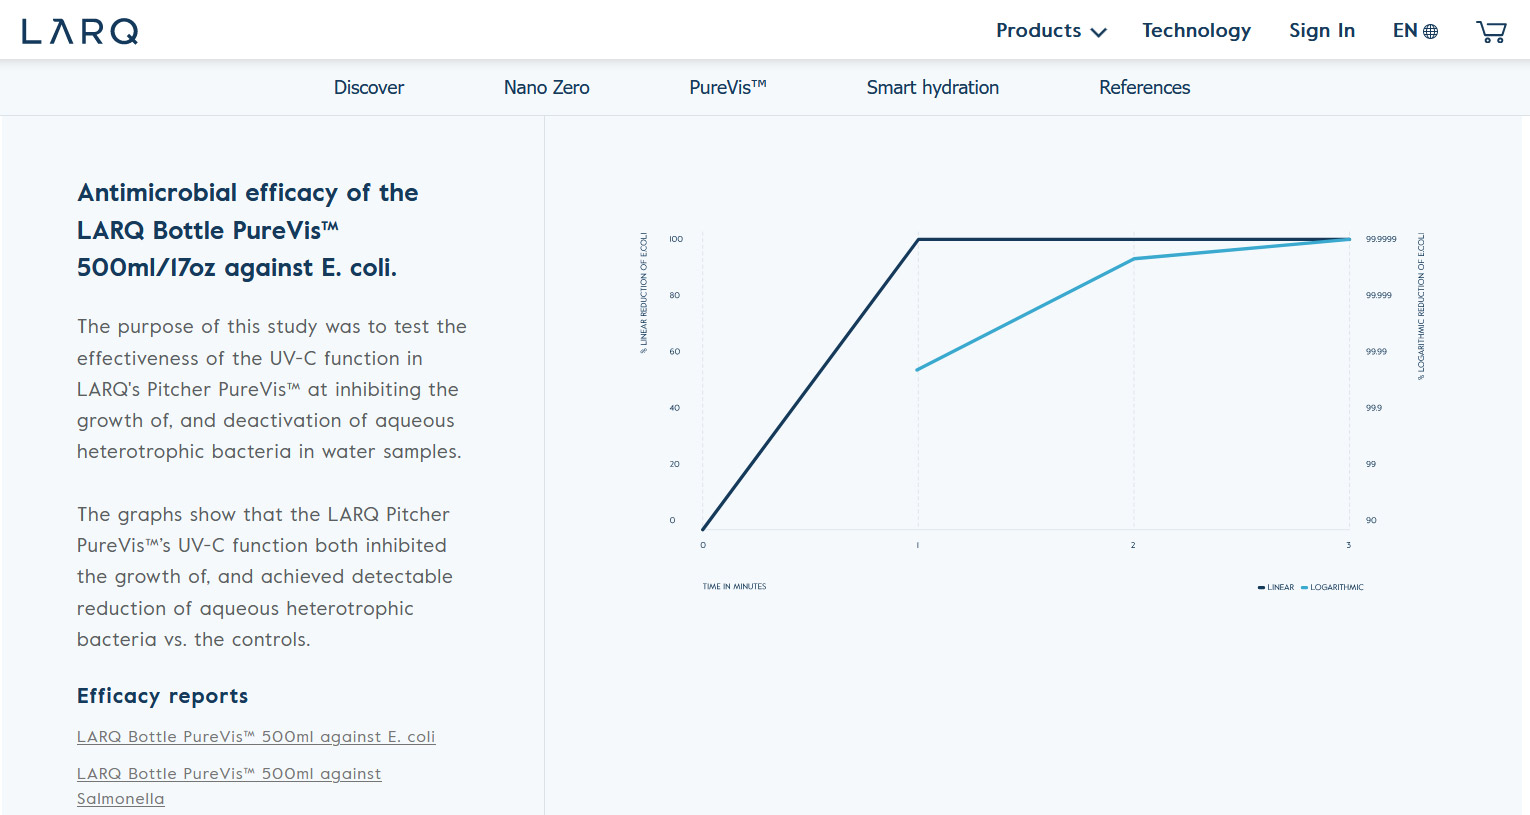
Take the example of the efficacy chart of the LARQ bottle featured on their website below. The graph shows how their bottle prevents E. coli and bacteria from growing. It is one factor that can help visitors purchase the product and remember the brand later as well.

Image Source: Larq
For an online store, you can also take inspiration from this visualization of data and establish credibility with potential customers.
Which Tools Can Be Used for Data Visualization?
Now that I have talked about why data visualization is important for brand credibility, let’s discuss how you can gather all the facts and numbers, and make them visually appealing. Here are a few great tools for data visualization.
- Looker
- Tableau
- Infogram
- Piktochart
- Chartblocks
- Datapine
- Zoho Analytics
- Visme
- Flourish
- DataWrapper
Brand owners, marketers, and designers can leverage these tools to create attractive visuals that can make people take a second look. Before you get started with data visualization assets, it’s a good idea to assess your brand elements. Make sure that you have a professionally designed logo that can be added to images or as a watermark on videos too.
Perks of Using Data Visualization Tools for Brand Credibility
When it comes to brand credibility, it’s imperative for you to see things from the perspective of the audience. Understand what they might be looking for in the market and help them make decisions with data-driven insights. Gather and segment data that backs up your claims so that your target customer knows that you have gone above and beyond.
Once you have the facts and figures, you can list or narrow down the types of data visualizations that might have the desired effect.
With the right tools, you can create assets that reflect your brand message and highlight valuable information that could generate interest among consumers. Here are some of the benefits of using data visualization tools for brand credibility.
Build Trust Among Gen Z Consumers
With the rise of platforms like TikTok and the popularity of Instagram Reels, more and more people are realizing the impact of Gen Z in the digital world. I mean, it’s no surprise that business owners today are in a race to grab the attention of their younger customers before their competitors.
Now, it is important to understand that adults between 18 to 25 years of age prefer watching videos or looking through visuals more than any other media.
So, to make a strong impression on your Gen Z audience, you need to present data or facts that do not come across as ‘boring’ or overwhelming. By using tools like Piktochart for infographics or Chartblocks to create a bar or flow chart, you can instantly catch the eye of a visitor browsing through your website.
This also applies when courting Gen Z workers for recruitment and retention. As well as having tools for organizing employee data for purely practical purposes, you need to be able to put this info to work in your favor by using visualizations to showcase the benefits of joining the team to prospective hires.
Example
Take a look at how Binance appeals to its younger demographic of consumers with colorful charts to show trading data. Today, cryptocurrencies and NFT have attracted a lot of people who are looking for different career opportunities to achieve financial stability.

Image Source: binance.com
Higher Brand Memorability
While it may be kind of obvious, you need to consider it an important factor here. Visual assets can be an extension of your brand and create familiarity among a wider audience. It’s easier for people to share appealing static or dynamic images on various platforms like Instagram, Facebook, Twitter, and LinkedIn.
Other blogs might also feature infographics or carousel posts with credits if the information is valuable for their visitors. Now, all of this can help boost brand memorability and recognition.
You can use tools like Flourish or ZillionDesigns’ Color Palette Generator to customize the colors in visuals. It’s a good idea to use your brand colors for consistency and relevance. This way, you can help people remember your business and think about it later on as well.
Example
HubSpot is one example of a brand that features its logo colors in data visualization assets. Take a look at the Instagram post shared on the company’s profile below. The coral and charcoal combination is used to highlight stats for marketers and business owners. It immediately reminds the audience of HubSpot and makes a strong impression on new visitors too.
Improve Efficiency and Results
If you think about it, technology has simplified a lot of tasks for us. Today, business owners can leverage various tools and platforms to reach out to potential customers and generate sales. Shopify, for instance, is a great example of a tool that disrupted industries.
It played a role in the rise of eCommerce and has made it easier for startup owners to pitch their products to the target audience with Shopify marketing strategies. Much like this tool, using data visualization ones for brand credibility can also be quite beneficial.
One of the top reasons to consider them is the increase in efficiency and productivity. When you utilize platforms like Looker or Tableau, you can save time on segmenting and filtering data, and reduce the possibility of errors too.
Example
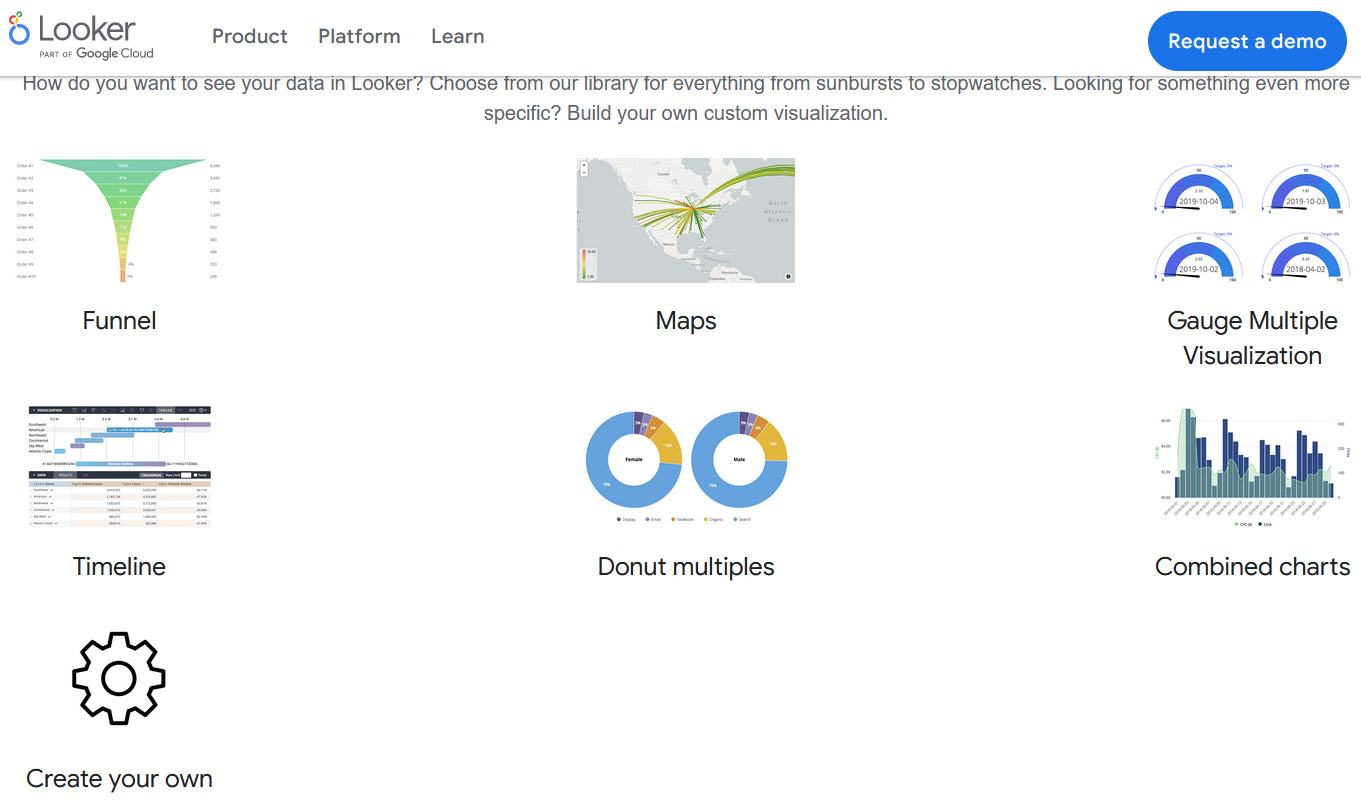
Looker, for example, allows users to create maps, charts, or customized visuals that make raw data easily understandable. You can add insights to blogs or case studies or include models or diagrams on your website to earn the trust of potential customers.

Image Source: looker.com
In the end, this improves efficiency and allows you to achieve the desired goals or results in a short time. You can cut down on resources and create data visualization assets that look professional and give the power of decision-making to the consumer.
Define and Clarify Unique Selling Point
With each day, competition in every industry is only increasing. This makes it more challenging for businesses and brands to stand out and draw the attention of their audience. So, how do you make a strong impression on potential customers? The simplest answer to this is, your unique selling point or USP.
Think of what makes you different from others. Identify the factor that can only be associated with your brand and nobody else. Once you define the USP, you need to strategize how to convey or highlight it for potential customers.
This is where data visualization tools can literally save the day. I mean, when it comes to the perks of using them for brand credibility, this is a big one. You can create animations, sliders or interactive visuals, or comparative charts that give them a clear idea of the USP.
Example
With data visualization, businesses can show what makes them different from their competitors and draw attention to how they can solve a problem for users or potential customers. Take the example of Storemaven here. The SaaS platform provides a solution for app testing and design to businesses across the globe.
On their website, visitors can find dynamic visuals that highlight the unique selling point of this brand. Storemaven has focused on presenting data that shows real pain points to potential clients looking to build their digital presence. It defines the USP of the business that aims to help people overcome any challenges and experience growth.
Create Actionable Visual Assets
Last but not the least, when you use data visualization tools for brand credibility, you can create or design visual assets that convince people to act quickly. Let’s talk about a B2B SaaS website here to help you understand.
What’s the one thing that most business owners want to achieve in a given time? Conversions or sales. This can be a bit tricky for startups and SMEs in the beginning. According to an industry report, the average conversion rate for SaaS websites is between three to five percent.
To reduce this, you need to come up with effective strategies that keep people interested in your product or service. Data visualization tools provide an easy solution here. With visual assets like infographics and illustrative charts, you can convince people to act promptly.
Example
Take a look at the actionable prompts that MailChimp added to its annual report for 2021. It’s highly interactive and has a series of illustrations that can keep the user scrolling toward the end. The subtle CTAs have been incorporated into the report so users can immediately act and look up the services offered by MailChimp. I find this example very interesting and inspirational.

Image Source: mailchimp.com
In the end, the idea is to create an actionable visual asset that helps increase conversions in a short time. It’s also a good way to earn the trust of potential customers and build loyalty in the long run.
The Bottom Line
These are some of the perks that you can get from using data visualization tools for brand credibility. Whether you are looking to feature visuals on a professionally designed website or create posts for social media platforms, these tools can be incredibly useful for your branding and marketing campaigns. So, think about how you want to connect with potential clients or customers and start designing visual assets to break down complex data.


