How to Visualize Data Through Appealing Infographic Design

Featured Image: iStock/Nataliya Ustyuzhantseva
An infographic is also known as an information graphic. It serves as an essential tool for the visualization of data, using graphs, charts, and images to communicate complex information enjoyably and engagingly.
Content marketing relies heavily on data visualization and infographics because people perceive visuals better than plain text.
To help you create infographics that effectively communicate your brand’s message, we have provided tips, best practices, and a few examples as well. This guide will assist you in creating compelling visualizations that resonate with your audience, whether they are used for social media campaigns, marketing campaigns, or data-driven reports.
The Role of Data Visualization and Infographics
When visuals were used to explain a task, researchers found that errors decreased by 80%. The use of infographics has many benefits, including improved comprehension, increased engagement, and better retention. Here are a few details on each of these benefits:
1. Simple to Understand
By visualizing data, complex information can be simplified and made more accessible to a wider audience. When data is presented in a visually appealing manner, it is easier to comprehend and grasp the information quickly.
Imagine that you wish to inform your audience of the popularity of the Maggie food brand or any brand for that matter. It seems like a rather boring topic, doesn’t it? The graphic designer went all out and came up with a very creative design that was convincing to the audience.
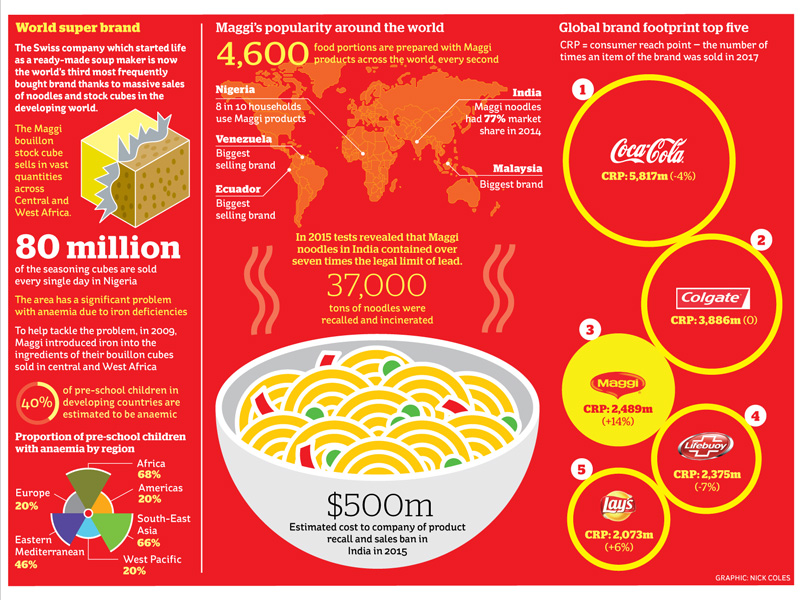
Image Source: dribbble.com
2. Provides An Engaging Experience to The User
The purpose of data visualization in infographics is also to tell a story, and to do so your content must be engaging and visually appealing. The audience will be able to maintain interest and attention if this is done. You use your brand colors to boost recognition and your logo design as well.
The design for Spotify’s global trend report 2020, for example, may have evoked different reactions from the audience. You can see statistics of the most played songs during workouts and which countries were the most active. By exploring the different areas of the design, you will be able to gain a deeper understanding of the significance of music in people’s lives

Image Source: newsroom.spotify.com
3. Helps Simplify Communication
The use of infographics is extremely versatile, serving as a powerful tool for explaining complex data, simplifying information, or presenting complex data in a visual and accessible way. The ability to share content across multiple channels, including print and digital platforms, makes it an ideal communication tool.
It is possible to adapt an infographic to a variety of formats, such as a poster, flow chart or comparison table. You can convey your message successfully with such data visualization techniques.
4. Easily Shareable
Infographics are frequently shared on social media, whether you are creating a blog post or social media content. This is an effective means of reaching a wider audience. For example, Course Hero uses creative infographics to explain literature with main characters, using visual cliff notes as a means of educating their readers.
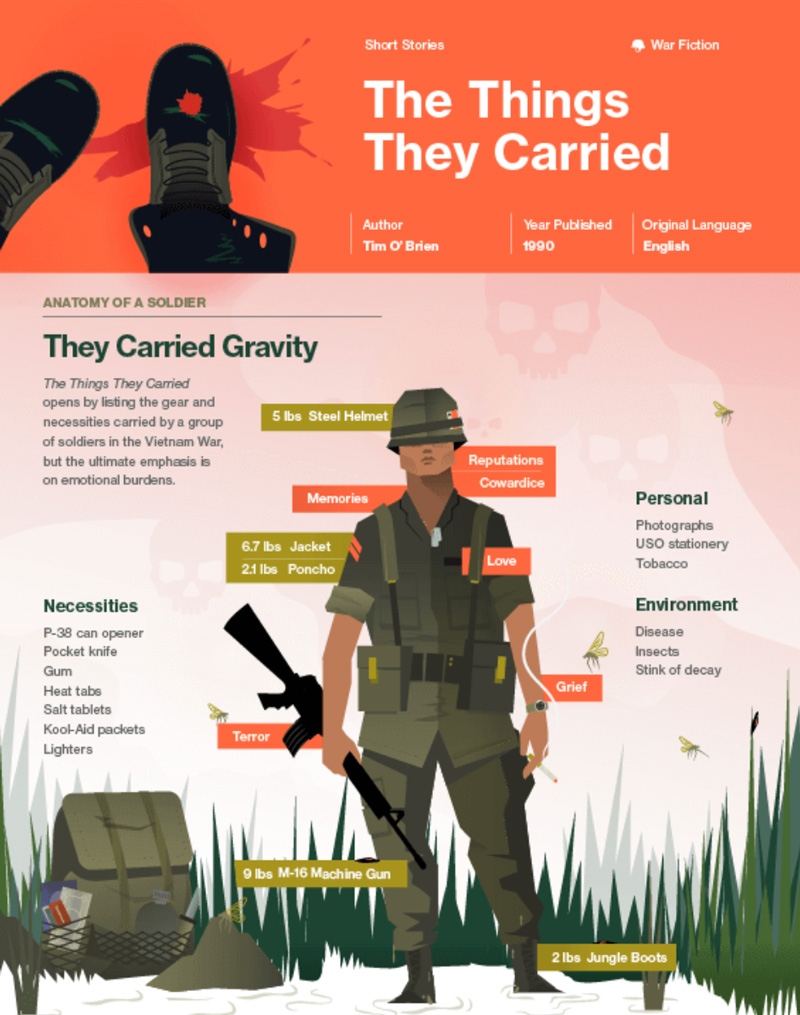
Image Source: designcuts.com
5. Provides Relevant insights
By using infographics to highlight key insights and trends, decision-makers can make informed decisions. Try to make sure that you brand data visualization assets so that people can recall your business later on easily.
When it comes to data visualization providing insights, LinkedIn marketing solutions can be used as an example. It is designed to provide value to marketers. You can also find an infographic on “A well-balanced blog” in their recent newsletter. On that note, using LinkedIn automation tools is an underrated way of getting your infographics in your potential customers’ inboxes.
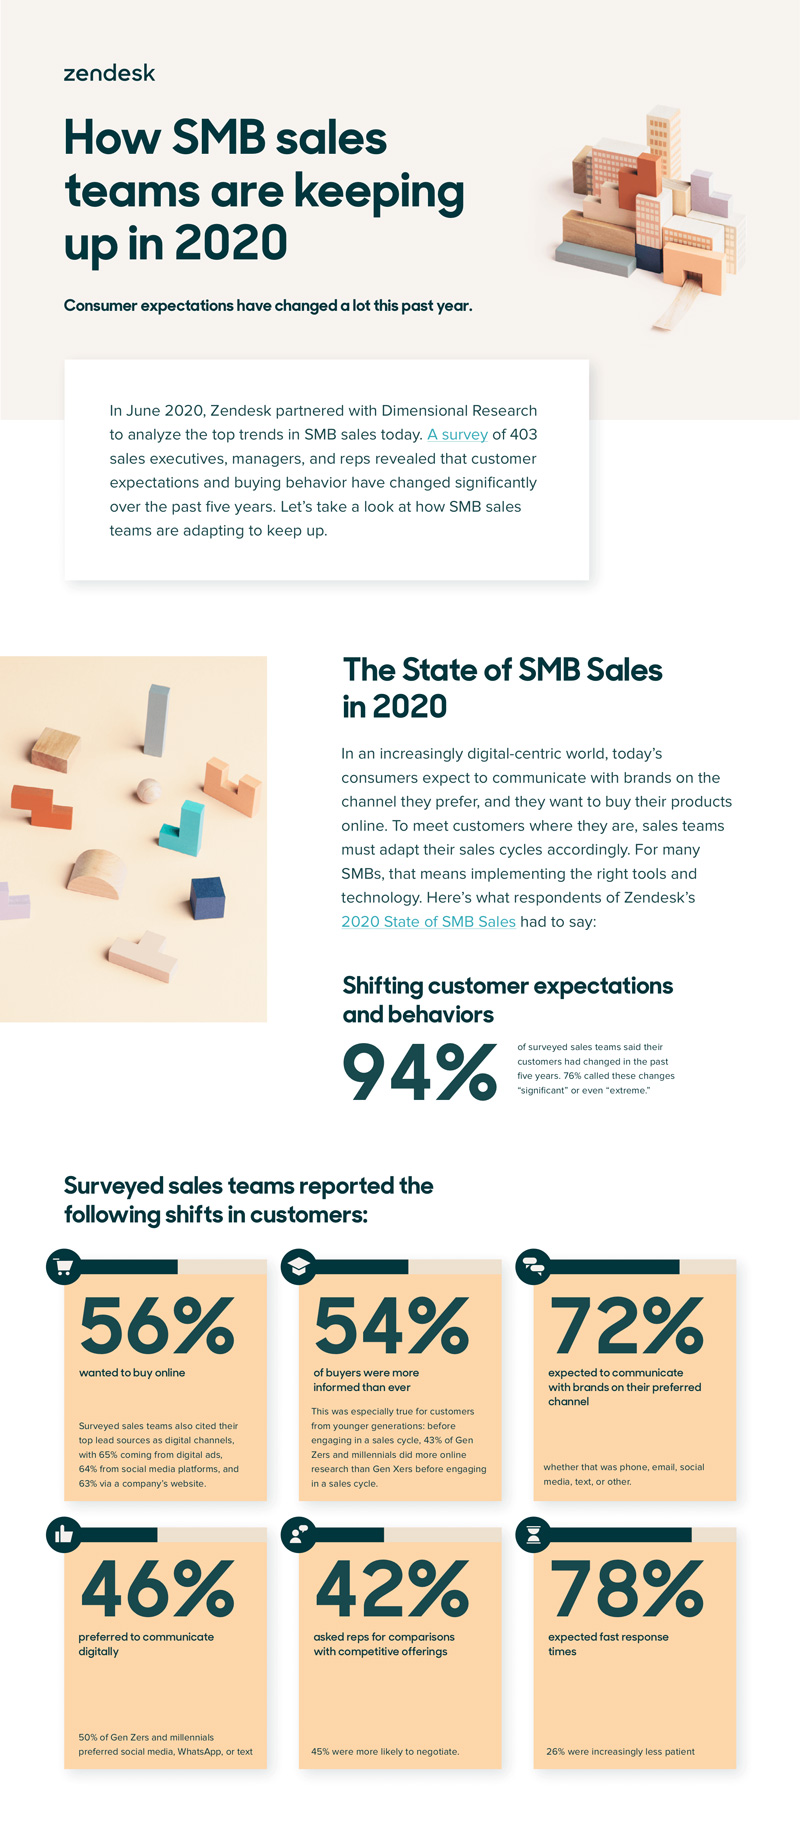
Image Source: zendesk.com
How to Visualize Data in Infographic Design
A strategic approach is required to maximize the impact of infographics that incorporate data visualization. The following are some tips on how to combine these two techniques effectively.
1. Create Memorable Visuals
A successful infographic relies heavily on data visualization. A visual representation of complex data, such as charts, graphs, and maps, allows viewers to understand trends, correlations, and comparisons with greater ease. You can create more compelling and informative infographics by utilizing visuals that assist in retention and memory recall.
Take the example of designing an infographic in support of a health campaign. An attractive bar chart depicting obesity rates over time would be more impactful than a list of obesity statistics.
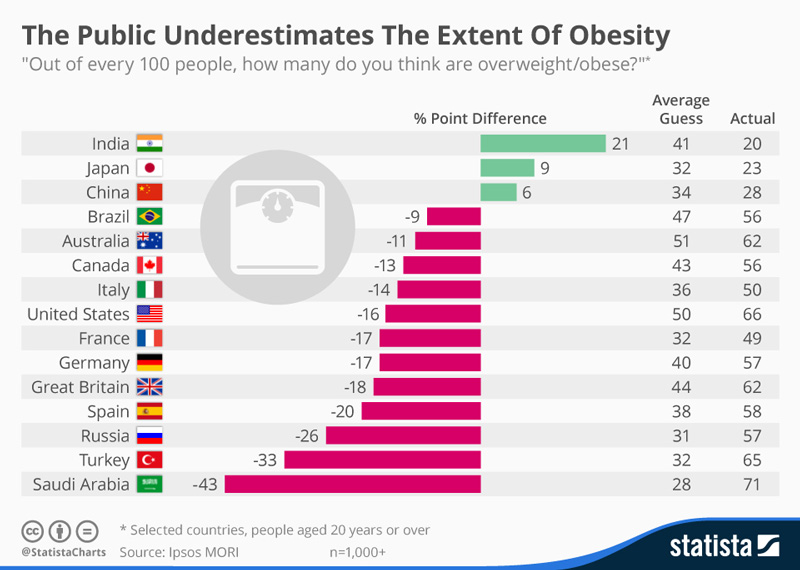
Image Source: statista.com
2. Highlight Essential Information in Design
Effective information graphics are based on relevant, well-curated data. The first step is to identify key data points related to your topic that reinforce the message you wish to convey. Ensure that the chosen data contributes directly to the narrative by striking a balance between data richness and simplicity.
For example, suppose you intend to create an infographic about the use of smartphones. It is important to rely on peer-reviewed research conducted by the Pew Research Center or Statista to ensure accuracy and reliability or any other reliable and authentic resource.
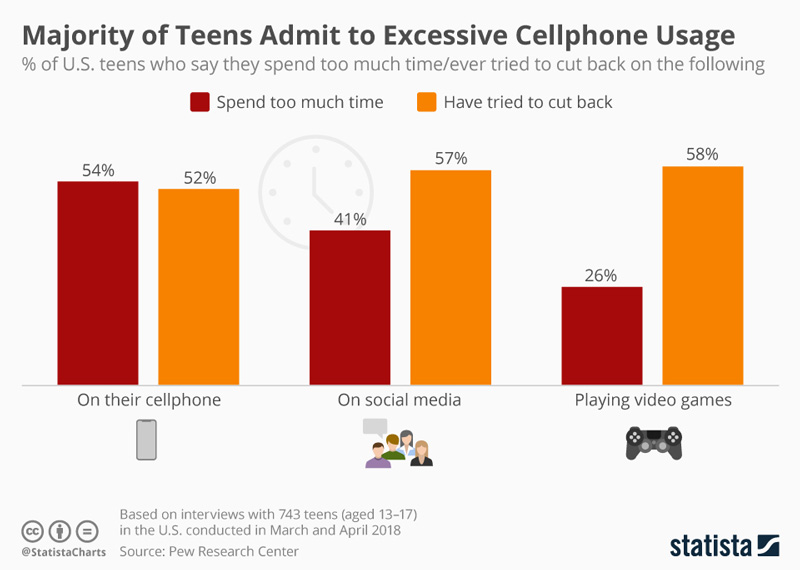
Image Source: statista.com
Make sure that you include your brand elements in all visuals. You can use different data visualization tools to build brand credibility.
3. Choose the Right Visualization Technique
A variety of data types require a variety of visualization techniques. Compare quantities with bar charts, illustrate trends over time with line graphs, display proportions with pie charts, and present statistical information on the basis of maps. Make sure that your visualization choices are tailored to the characteristics of the data to convey information effectively.
It is possible to convey the percentage distribution between different programming languages using a horizontal bar chart in an infographic regarding the popularity of different programming languages.
If we want to demonstrate the usage of mobile phones over the past decade by people according to their monthly income, we can use line graphs.

Image Source: halo-lab.com

Image Source: researchgate.net
4. Understand Infographic Design Principles
An infographic’s design is critical to its visual appeal and coherence. The color scheme, typography, and iconography should be consistent throughout the design. Organize your content logically by utilizing white space to prevent clutter. Layouts that are well-structured guide the viewer’s eye and make the content easier to read.
If you are adding infographics to a website, it is a good idea to get an insight into all the key principles. Before doing so, make sure you get a professionally designed website for your business where your visually appealing infographics can stand out.
5. Consider Demographics in Your Design
A percentage or arrow bar template can be used to display demographic information about the audience. You can use the arrows to illustrate growth, steps, or relationships between your data points. As with the percentage template (or pictograph), a grid of icons represents data by repeating rows of numbers. Pictographs, also known as icon charts, picture charts, or pictograms, provide an attractive display of data that is easy to understand.
With the arrow bars template, you can visually explain key data, illustrate step-by-step processes, or illustrate relationships between data. Use a percentage template to make statistics memorable and captivating, report progress towards a goal, or add visual interest to your presentation.
A greater number or percentage is implied by a longer arrow bar. Your list should have a proportionate size for each bar. Here is an example of a pictograph you can view.
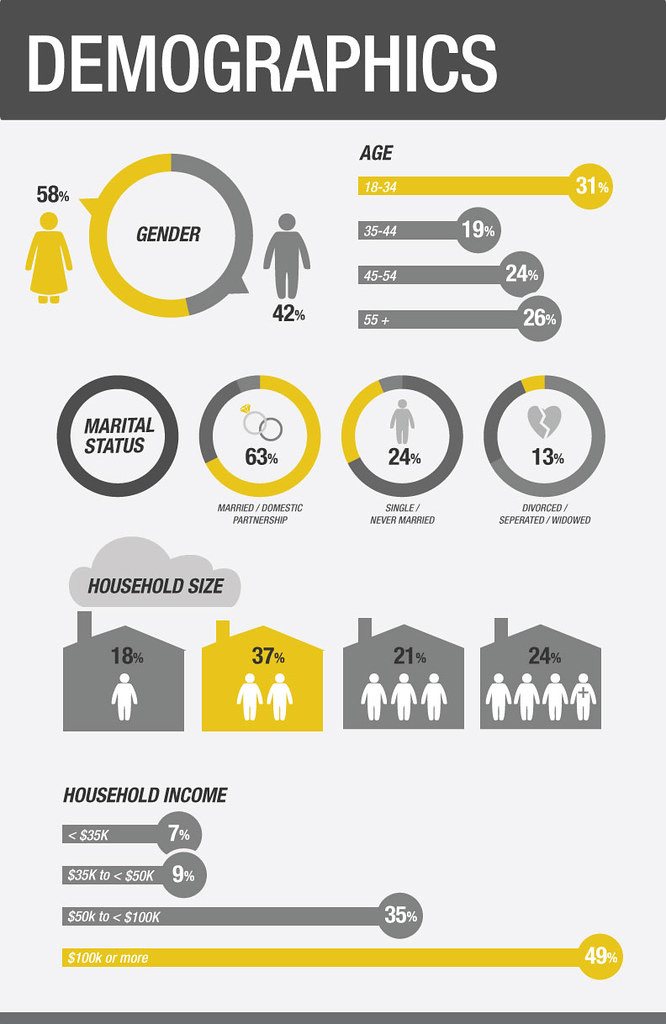
Image Source: pinterest.com
6. Visualize Market Share
A comparison slide can be used to plot the share of voice. You can add a data comparison infographic slide to your presentation to add a visual twist to a plain, old bar chart. Try different online tools for infographics and illustrations to create visually appealing designs.
In the data comparison, infographics, slices, bars, or circles may be used to contrast the data in comparison. Usually, percentages will be displayed instead of exact numbers in the data comparison infographics. Be sure your data is compelling and makes a statement.
7. Make Your Design Engaging and Interactive
Make your infographics more engaging by adding interactive elements. Add elements that can be clicked for more information, animations that highlight changes to the data, or tabs that allow users to view the data from different perspectives. By providing interactive infographics, users can explore the content at their own pace, thereby encouraging active engagement.

Image Source: freepik.com/rawpixel-com
You can use various tactics to make data metrics for interactive UX design that are interactive and draw focus immediately.
Top Tips for Visualizing Data in Infographic Designs
Here are a few tips to follow for making your infographics appealing to the audience.
1. Follow a ‘Less is More’ Approach
When there is a lot of data to share, it can be tempting for designers to create complex infographics. Creating an infographic with many layers seems to be the most effective approach. However, that is not the best approach to design.
To make your design understandable to your audience, complex data must be simplified. They cannot decipher the data either. Overloading a graphic with data, as in the example below, can lead to your audience losing interest.
Potential leads will have difficulty locating key data points in this infographic due to the large number of colors and pie charts. It will take your users more time to decipher it than to understand the information, which will inevitably result in them scrolling past your content.

Image Source: yellowfinbi.com
2. Keep Text Minimal
An infographic is a great way of sharing a complex story because it combines text and graphics. However, when data is visualized poorly, it is necessary to include too much text in the graphic to explain what the data means.
Users must read the sidebar to gain a better understanding of the data presented in the graphic. Infographics with visualized data are not designed for that purpose; if you want people to read your graphics, you may as well have a blog.
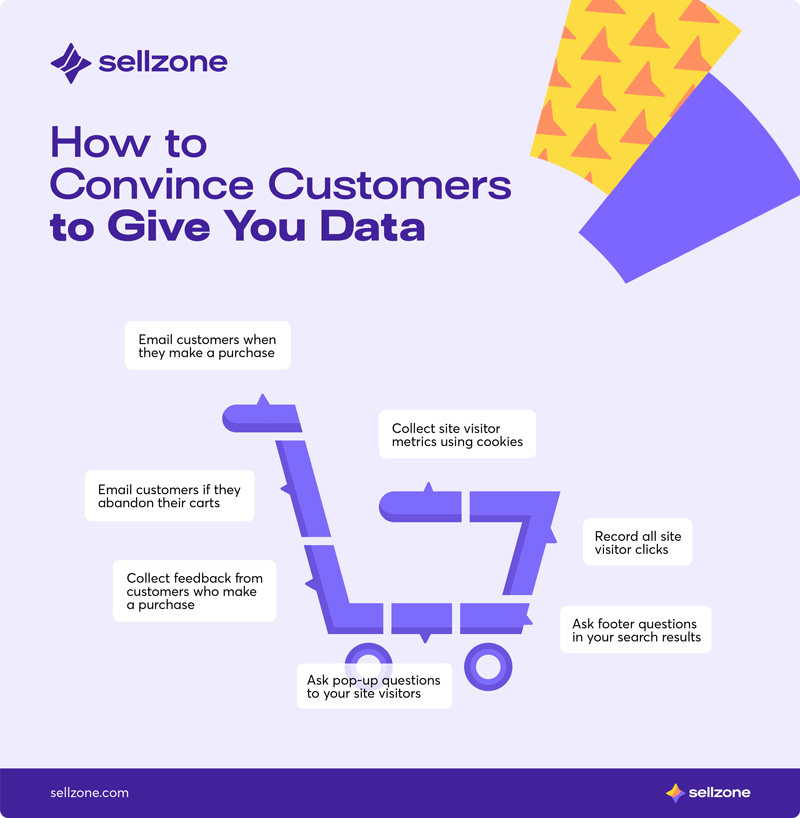
Image Source: sellzone.com
The purpose of visual communication is to connect data and share information with the widest audience possible. You have chosen the wrong charts if they cannot stand on their own. It is also possible that you are sharing more data than is necessary.
If you wish to reach more than one lead with one graphic, the data must be easily digestible and bite-sized. It is more effective to use visual elements rather than text, for instance, icons, illustrations, and pictures. Keep in mind that your brand symbol also needs to be featured on the infographic. Create one with an AI logo generator beforehand so you can easily add it on different visual assets.
3. Visualize With Color
The use of color plays an important role in visuals since it serves a variety of purposes and allows marketers to share data in a variety of ways. When designing infographic and visualizing data, marketers and designers should be cautious when incorporating colors.
It is not necessary to use all the colors you have access to, just because they are available. Ideally, your color palette should consist of no more than a handful of colors.
It is possible to become overwhelmed when there are too many colors, while too few colors will create false connections between data. Information can be conveyed effectively with three to five colors.
Make sure you adhere to your brand’s colors when selecting colors. Avoid selecting a palette that is similar to that of your competitors. The Instagram statistics on the right demonstrate how the brand colors for the platform are used to illustrate the chart.
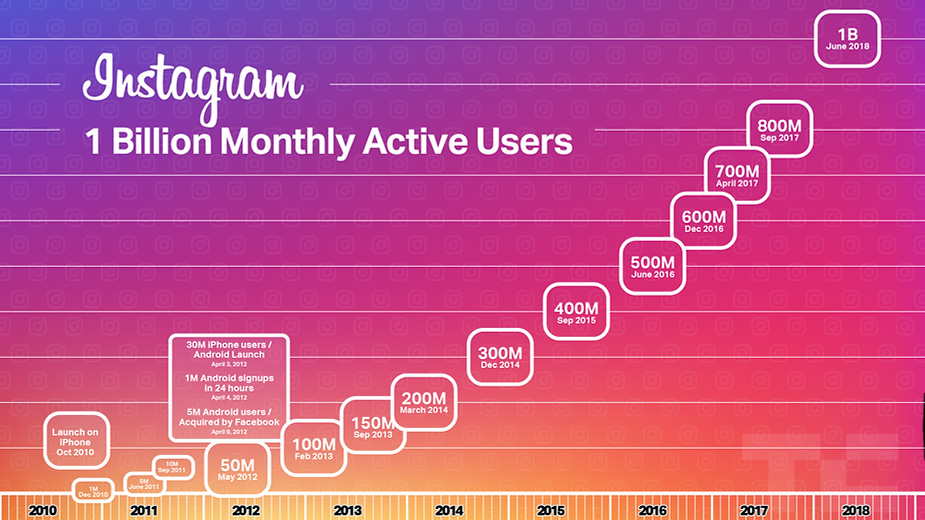
Image Source: degomglobalmarketing.com
Additionally, you may wish to use different hues of the same color. Consider reducing color transparency to increase the range of your visuals. The use of colors within a design must serve a purpose, such as communicating information or creating a particular emotion in the viewer.
4. Create Hierarchies
For users to understand your infographic story, you must have a visual hierarchy. It is crucial to have this as it can help you communicate effectively – since people attribute meaning to patterns as they observe them.
You should create a distinct hierarchy in your visuals to help users find correlations within the data. Creating visual hierarchies within an infographic can be done in several ways:
- Utilizing different hues of color
- Font size reduction
- Combining related elements
- Visuals and text placement
- Changing the style of elements
Here is an example you can consider.

Image Source: greechat.com
5. Add Striking Contrast
A key design principle of infographics is contrast, which helps create visual interest and highlight key elements. By using colors, font sizes, and visual elements such as icons and illustrations, you can add contrast to your design and make it appear memorable too.
Conclusion
It can be challenging to visualize data through appealing infographic design. But once you get the right idea, you can win with data visualization techniques. In the right circumstances, these visuals may be effective in attracting leads and increasing conversion rates. We hope this guide helps you understand the importance of infographics and what important things to remember when designing them for your website to attract the audience.
